Amongst the bounty of lessons pirate radio has revealed to the world, one such piece of wisdom endures. That is: you have to give the people want they want. As the story goes, in the early 60s a group of pioneers set up their pirate radio stations to cater to the growing demand for pop and rock music. A demand which at the time, the Beeb (BBC) would not supply.
Most people continue to not be in possession of a decrepit ship moored off the English coast. However, they are more likely to possess a computer now than ever before. This makes the process of setting up an independent radio station decidedly easier. However, what remains eternal is the challenge of broadcasting content that slaps and keeps listeners coming back for more. But how do you really know you're giving the people what they want? One source of validation is listener stats.
Here at Radio Cult we make it easy to create an online radio station. As part of this, we want to provide the stations that use our streaming platform with this source of validation. That's why we have a dedicated Analytics page on our streaming web app.
Let's see what's on offer.
I. A brief overview on how we source the data
Before we discuss what charts we offer as a means of visualising your station's influence, let's first give you a brief (and hopefully not too technical) explanation on how we source the data that forms the basis of all your charts.
Whenever a listener locks into your stream, we log metadata about each and every one of these listening sessions. This metadata can include the type of device used by the listener or the date and time of each individual session.
Our analytics are extremely privacy-conscious. None of the data leaves our system. It is never sold to any third parties. We never reveal, or even record, any personal information. Even we cannot individually identify any of the users. You can rest assured that you are getting actionable insights on how listeners interact with your stream without breaching the privacy of your users.
II. The listener analytics we provide
We could collect all the metadata in the world about listener interactions with your station's stream. But it would be next to meaningless without an effective way of visualising it. Put simply the data needs to be transformed into information.
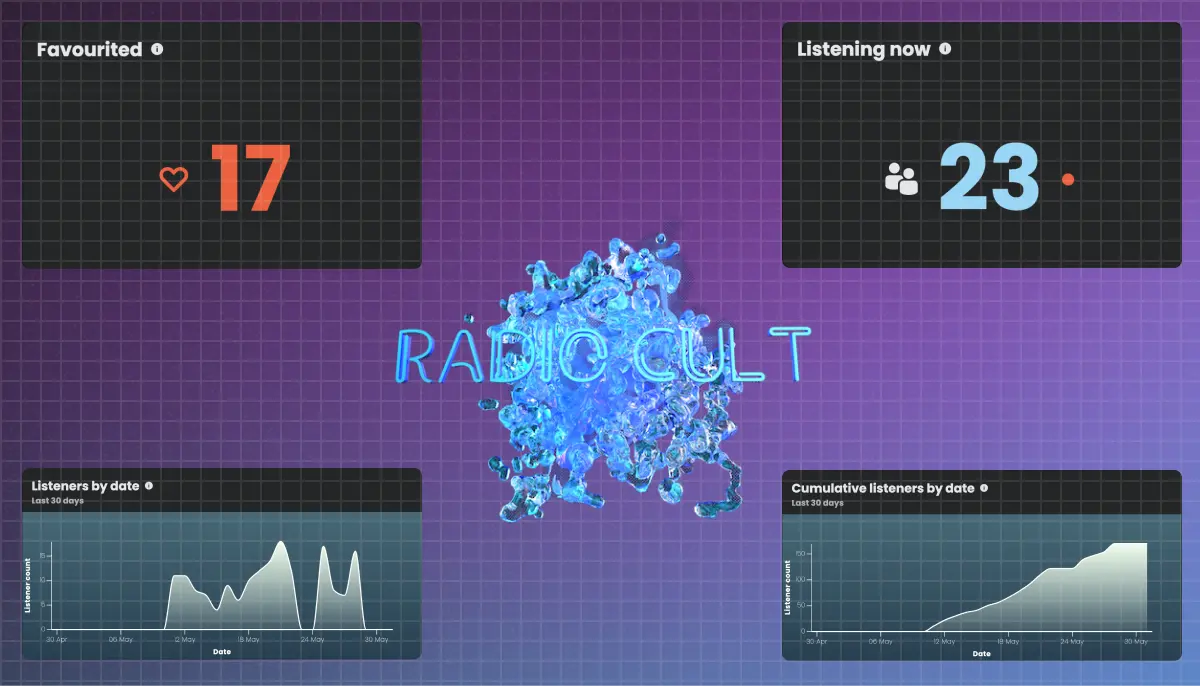
We have done this by providing a series of charts for you to visualise your station's listener stats in an easy to consume manner. Such charts include a line graph which plots your total listener count for each day in the given range or a pie chart which reveals the relative breakdown of what countries your listeners are locking in from.
Currently, all the appropriate charts are measuring all listeners (i.e. listener sessions) rather than unique listeners. So if the same user listened to your station on three separate occasions within the same day this would contribute three to the overall total, rather than one if we were tracking unique listeners instead.
Rest assured, what's currently on offer is far from the final product. We plan to give you greater customisation over what's displayed in front of you, with future features including letting you decide whether you see all listeners or unique listeners. More importantly we have plenty more charts in the pipeline, all with the aim of providing you with a complete as possible picture of the reach your radio station has.
III. The value our analytics can provide you
So we've collected the metadata and we've built the charts. But the charts mean nothing if you don't get value out of them. The question becomes, how can you interact with the charts in a consequential way? As we mentioned right at the beginning of this blog post, listener stats can be a key source of validation to see whether your content is really resonating with your audience. Let's explore how you can actually validate ideas and changes to your station.
Say you've made a recent scheduling change where you've included a new show. You think the new show is delivering the goods, but how can you confirm that your audience is of a similar opinion? Well our charts should help reveal the answer. If you see an uptick in the daily total listener count after the new show is live or the listening now count has increased from the historical average when the new show is on, then you have your answer.
Our analytics can also be a source of inspiration. Say you view one of our country related charts and you notice a significant amount of listeners are locking in from a country not of your own. Your potential responses to this scenario are plentiful. A big response may be to include more music known to be enjoyed by that country. A much simpler response may to include shout outs to those listeners during your upcoming shows.
What is illustrated above is just a couple of examples of how you can get value from our analytics. There are sure to be a lot more and we hope you let us give you the opportunity to discover them.
We hope you found this article helpful and informative. If you ever have any questions, need any additional services or you have any suggestions/feedback on our analytics, feel free to reach out to us here at Radio Cult. We are the home of community radio and we can't wait to help you. If you're after a more general discussion about the benefits of listener stats, make sure you check this blog post out.
As always, keep it locked.

