Key Takeaways
Listener analytics tell you who is tuning in (location, device, and app) and how they behave (sessions, unique listeners, peak listeners, total listener hours, and average session duration).
Online audio is now a near-universal habit: 81% of Americans aged 12 and over listened in the last month in 2026 (Edison Research), so understanding your slice of that audience matters more than ever.
RadioCult's built-in analytics track listeners across every website, app, and embed, with 12 months of exportable history for sponsors and grant applications.
Use the data to test shows and time slots, follow geographic demand, and prove your reach to advertisers in a US digital audio ad market worth $8.4 billion in 2025 (IAB).
Listener analytics tell you who is tuning in to your online radio station, where they are, what they listen on, and how long they stay, so you can replace guesswork with decisions that grow your audience. For an internet station competing for attention, that data is the difference between programming on instinct and programming on evidence.
The payoff for acting on that data is real. Across the wider economy, the businesses that respond fastest to live data pull away from the rest: the leading "real-time" companies post 62% higher revenue growth and 97% higher profit margins than their slowest peers (MIT CISR). A station that reacts to what its listeners are doing right now is playing the same game on a smaller field.
And the audience is there to be understood. In 2026, 81% of Americans aged 12 and over, around 233 million people, listened to online audio in the last month, a record high, with 76% tuning in every week (Edison Research, The Infinite Dial 2026). Online listening is now a near-universal habit. That is a huge opportunity, but it also means more stations than ever are competing for the same ears.
This guide covers the listener stats worth tracking, where to find them, and how to turn them into better shows, stronger sponsor pitches, and a bigger audience.
Every RadioCult plan includes real-time listener analytics. See yours in minutes.
Get 7 days freeWhat your listener analytics actually tell you
Your station generates a wealth of listener data, and it falls into two families that answer two different questions.
Who your listeners are. Demographic and technical signals help you build programming that fits your actual audience:
- Location at the country and city level
- Device family and type (desktop, mobile, tablet, smart speaker)
- Operating system (macOS, Windows, iOS, Android)
- Application or browser used to connect to your stream
What your listeners do. Behavioural signals show you what is landing and what is not:
- Listener sessions over a period
- Unique listeners versus repeat listeners
- Peak listeners at any one moment
- Total listener hours across your schedule
- Average session duration, or how long people lock in
Your audience is not static, either. Online audio is growing fastest among older listeners: monthly reach among Americans aged 55 and over jumped from 52% to 70% between 2024 and 2026 (Edison Research, The Infinite Dial 2026). Assumptions about who is listening go stale quickly, which is exactly what the data is there to check.
Where people listen has shifted decisively to connected devices, too. In the UK, online listening overtook AM/FM broadcast for the first time in early 2024, and by Q1 2025 smart speakers alone made up 18% of all live radio hours as AM/FM slipped to 27% (Ofcom, Media Nations 2025). In the US, two in five people aged 12 and over now own a smart speaker, an estimated 112 million potential listeners (Edison Research, The Infinite Dial 2026). Knowing which of these your audience actually uses tells you where to put your energy.
The metrics every online radio station should track
If you are not sure where to start, these are the core metrics to watch on your station, and the questions each one answers:
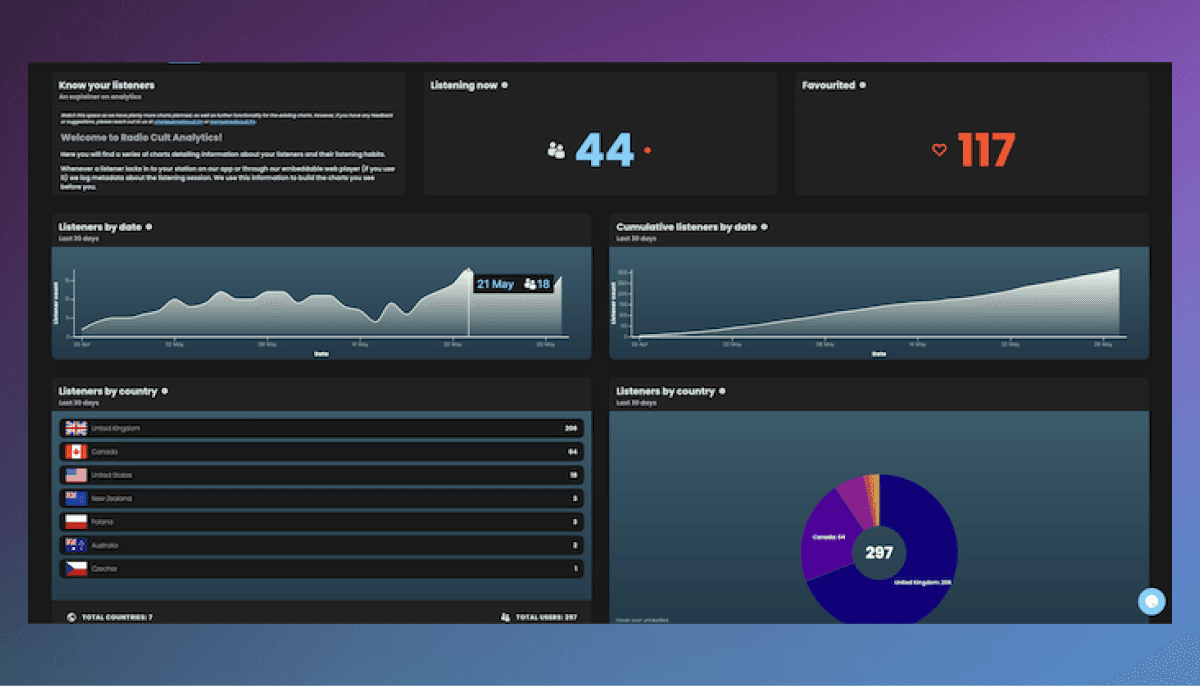
- Listening now: how many people are on air with you at this moment.
- Unique listeners: the size of your real audience, with repeat connections stripped out.
- Peak listeners: your high-water mark, and which show or moment drove it.
- Listener sessions: total tune-ins over a day, week, or month.
- Total listener hours: the aggregate time your station held attention.
- Average session duration: whether people stay for a set or drift after a track.
- Location: the countries and cities your signal is really reaching.
- Device, OS, and application: how listeners connect, so you can meet them there.
RadioCult insight: Accurate numbers only matter if you trust them. Our analytics are event driven, filter out bots so your figures reflect real people, and are stored for 12 months so you can see how a whole year played out. For the full breakdown, see how our listener analytics work.
See what your listeners are really doing with RadioCult's built-in analytics.
Get 7 days freeWhere to find your listener stats
The tools available to you depend on how you broadcast. In most cases, the analytics are already sitting inside the platform you use.
- Audio streaming: If your station runs on a platform like RadioCult, you already have an analytics suite built in. It tracks listener sessions, unique and peak listeners, total listener hours, average session duration, and location and device breakdowns, then displays them as charts you can filter by date and refine.
- Video streaming: If you broadcast video through Twitch or YouTube, both provide their own audience and revenue analytics for your streams.
- Website traffic: To measure visits to your station's site rather than your stream, a tool like Google Analytics fills the gap.
The advantage of built-in stream analytics is coverage. Rather than counting listeners on a single player or embed, RadioCult tracks them across every website, app, and embed your stream reaches, without harvesting personal data or bolting on a third-party tracker.
How to turn listener stats into better programming
The real payoff of tracking stats is using them to improve what you put out. A few concrete ways to do that:
- Analyse show performance. Track which shows and segments hold listeners and which lose them. Use it to shape your programming schedule around what your audience actually turns up for.
- Test formats and time slots. If a show is not landing, change something and let the numbers judge it. Watch the daily total listener count or compare the "listening now" figure against the historical average for that slot. An uptick is your answer.
- Follow the map. If your location data shows a cluster of listeners from a region you did not expect, act on it, whether that means playlisting music known to resonate there or simply shouting those listeners out on air.
- Pair stats with direct feedback. Numbers tell you what is happening; asking listeners on social media, email, or surveys tells you why. Together they make a far stronger case for any change.
Using your numbers to win sponsors, grants, and funding
Listener stats are not just for programming. They are the evidence that unlocks revenue, and the market is tilting hard toward channels that can prove their reach. Advertisers now treat hard-to-measure media as billions in misallocated spend: the IAB estimates that better measurement could unlock more than $26 billion in additional media investment within a year or two (IAB State of Data).
The money is already flowing. US digital audio advertising grew to $8.4 billion in 2025, up 10.2% year on year, with podcast advertising alone up 17.6% to $2.9 billion (IAB/PwC Internet Advertising Revenue Report). Advertisers buy audiences they can measure, and an engaged audio audience is worth proving: host-read audio ads drive an average 50% lift in purchase and recommendation intent over non-host-read spots (Nielsen).
Your analytics turn "trust us, people listen" into a defensible number. The same data works in three directions:
- Advertisers and sponsors: show total listener hours, unique listeners, and the locations you reach to justify a rate card.
- Grant applications: back a funding bid to your local council or a foundation with hard evidence that your station resonates with its community. This is where 12 months of exportable history earns its keep.
- Your own goals: whether you measure success by reach or influence, analytics give you a concrete baseline and a way to track progress toward it.
Ready to turn your listener data into a growing audience?
Get 7 days freeFrequently Asked Questions
What are radio listener analytics?
Radio listener analytics are the metrics an online station collects about its audience, covering both who is listening (location, device, operating system, and app) and how they behave (sessions, unique and peak listeners, total listener hours, and average session duration). They let a station make programming, marketing, and revenue decisions based on evidence rather than guesswork.
Which listener stats matter most for a small station?
Start with unique listeners, average session duration, and location. Unique listeners tell you the true size of your audience, session duration tells you whether your content holds attention, and location tells you where your community actually is. Once those are second nature, layer in peak listeners and device data.
How accurate are online radio listener numbers?
It depends entirely on the platform. Numbers vary widely between providers because of how each one handles bots, duplicate connections, and paused streams. RadioCult filters out bots and de-duplicates connections so your figures reflect real people. See how our analytics work for the detail, and note that using official embeddable players improves accuracy further.
Can I use listener stats to get sponsors or grants?
Yes, and it is one of their most valuable uses. Advertisers buy audiences they can measure, and grant-makers want proof of community impact. Exportable metrics like total listener hours, unique listeners, and geographic reach give both a concrete case, which is why 12 months of retained history is so useful at application time.
Do I need Google Analytics if I use RadioCult?
Not for your stream. RadioCult already tracks listener activity across your players, apps, and embeds. Google Analytics measures a different thing: traffic to your website's pages. Many stations use both, one for listeners and one for site visitors.